

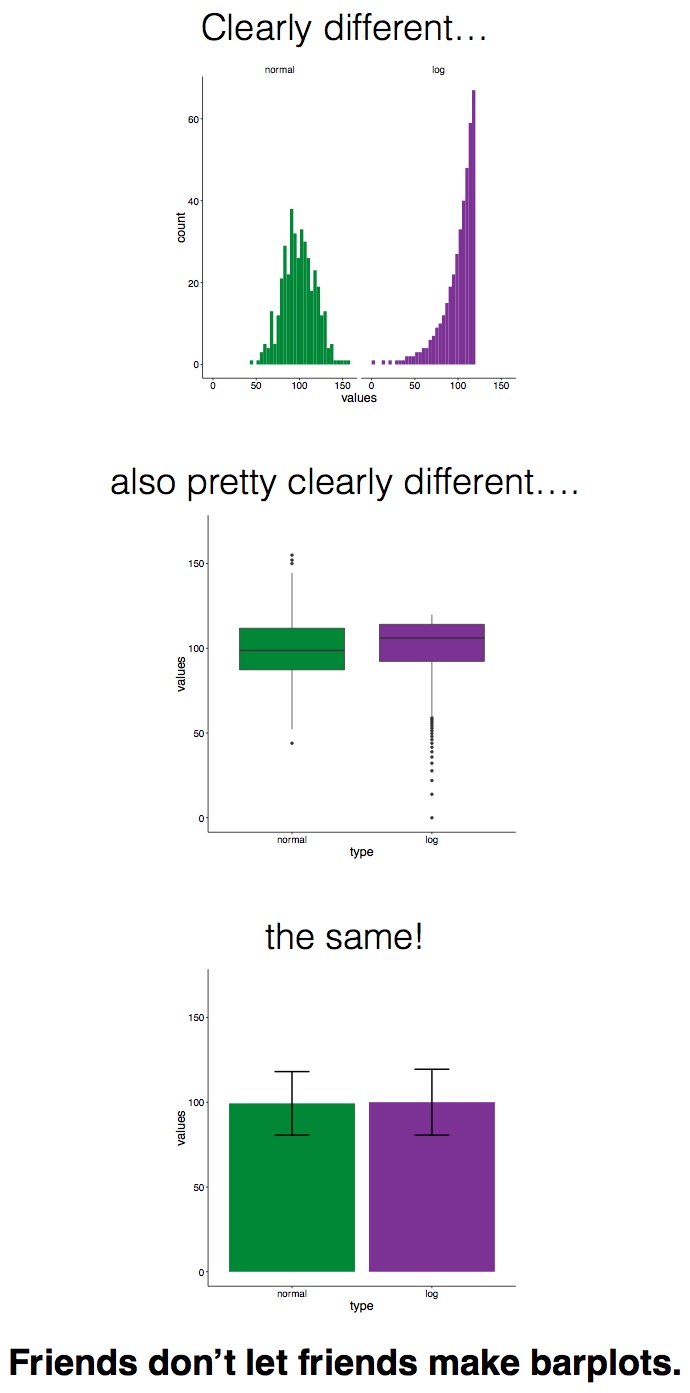
A while ago our resident ExpeRt Page blogged about the disadvantages of bar plots when plotting distributions, accompanied by this summary graphic.
This post not only generated a lot of online reactions (>200 retweets already – for our standards that’s close to breaking the internet!), but also a lot of discussion among colleagues in the lab. And indeed, while plotting might seem like something you just to in addition to the actual analysis, doing it the right way is arguably as important as analyzing the right way since, after all, the figures are the things most of us look at when we try to understand the results of an article.
